The DecisionTools Suite is a complete risk analysis for Excel that includes optimization, decision tree analysis and advanced statistical tools. The DecisionTools Suite means you can judge which risks to take and which ones to avoid, allowing for the best decision making under uncertainty.
Greater Than the Sum of its Parts
Each component of the DecisionTools Suite can perform a powerful analysis. When you combine these products, you can achieve more complete results than any single program can provide.
New in DecisionTools Suite
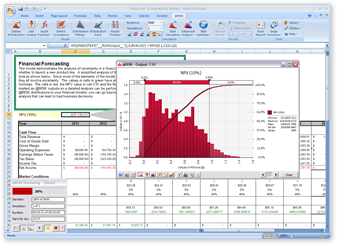
New DecisionTools Suite version includes a wide range of improvements, including powerful new integration of @RISK with Microsoft Project that allows you to perform risk analysis and Monte Carlo simulation on your Microsoft Project schedules – all from the @RISK for Excel platform! @RISK also adds simulation of time series models, easier-to-understand tornado charts to identify risk drivers, better graphing options, improved distribution fitting, and new distribution functions.
But there’s more to DecisionTools Suite 8.x than just @RISK. PrecisionTree 8.x adds powerful Bayesian revision and the ability to insert nodes anywhere in a tree. RISKOptimizer and Evolver 6.0 now include the OptQuest solving engine for even faster solutions on many types of models. RISKOptimizer, which has always shared functions with @RISK, is now even more tightly integrated with @RISK for seamless modeling. And StatTools and NeuralTools have added improvements to scatter plots and sensitivity analysis to the testing of neural nets.
Why go for the DecisionTools Suite?
FEATURES
BENEFITS
See all possible outcomes with Monte Carlo simulation
Avoid pitfalls and identify opportunities in @RISK or PrecisionTree models
Map out decisions with decision trees and influence diagrams
Identify and illustrate the best alternative
Works in Excel
No need to learn new applications from scratch
Genetic algorithms and OptQuest optimization methods
Solve linear problems – both large and small – quickly and accurately
Sensitivity or What-If Analysis
Identify the most important variables in @RISK or PrecisionTree models
Distribution viewing and fitting
Accurate description of uncertainty
Presentation-quality graphs and reports
Easily explain results and recommendations to others
Full integration between programs
Easily install and migrate between component tools; apply analyses from one tool to another tool’s model for greater insight
Parallel processing
Speed up large Monte Carlo simulations by using available CPUs within a single machine
Bundle pricing
Save money compared to buying products separately
<
New in @RISK 7.x
New @RISK version 7.x includes a wide range of improvements, including powerful new integration with Microsoft Project that allows you to perform risk analysis and Monte Carlo simulation on your Microsoft Project schedules – all from the @RISK for Excel platform! Other new features include easier-to-understand tornado charts, better graphing options, improved distribution fitting, new distribution functions, and much more. The Industrial edition now adds the OptQuest solving engine to RISKOptimizer, and features simulation of time-series forecasts.
New and Improved Tornado Graphs
Tornado graphs have long been used to identify the critical variables affecting a risk analysis. Version 7.5 adds a new graph type called Contribution to Variance which shows the amount of the variance in the output attributable to each input variable. In addition, you can now overlay tornado graphs from multiple simulations to compare the effects of model changes. Lastly, we’ve added shading options on the graph bars to indicate whether inputs are high or low when the output increases or decreases.
Faster Optimization with RISKOptimizer
RISKOptimizer, available in @RISK Industrial, is a powerful tool that allows you to optimize linear and nonlinear problems in uncertain situations. It combines optimization with Monte Carlo simulation, and is very computationally intensive. New version 7.5 now runs at least four times faster than previous versions!
Over 20 New @RISK Functions
Sixteen new distribution functions have been added to @RISK, along with six new statistical functions. The new functions are important for accurate, insightful modeling of uncertainty in finance, insurance, reliability, and other applications.
Run Optimizations During Simulation Without Coding
If you need to run Excel Solver during an @RISK simulation, you can now do so without writing any VBA code, saving you time. Version 7.5 makes this easy to set up via dialog box, and it works for Excel Goals Seek and Palisade's Evolver as well.
Graphing and Reporting Improvements
All @RISK graphs and reports now feature an updated, more streamlined interface, as well as support for Excel’s built-in themes and colors. Now you can apply your company’s standard Excel themes to your @RISK reports! In addition, graphical displays have been improved for ultra-high resolution monitors.
CPU Control
You can now control the number of CPUs @RISK uses to run simulations. We’ve also added easy access to @RISK statistics functions in the Model and Summary Results windows, saving you time in modeling.
Other cool features -
Integration with Microsoft Project
The new version of @RISK for Excel integrates with Microsoft Project, allowing you to perform all your risk modeling from the more flexible Excel environment. @RISK now imports your Project schedules into Excel so that you can use all of Excel’s formulas, and @RISK’s features, on your Project models. Excel becomes a front-end for your Microsoft Project schedule, linking directly to the underlying .MPP(X) file. Changes made in either Project or Excel are reflected in the other. When it’s time to run your Monte Carlo simulation, Microsoft Project’s scheduling engine is used for the calculations, ensuring accuracy.
Time Series Simulation
@RISK now offers a new set of functions for simulating time series processes, or values that change over time. Any future projection of time series values has inherent uncertainty, and @RISK now lets you account for that uncertainty by looking at the whole range of possible time series projections in your model. This is particularly useful in financial modeling and portfolio simulation.
@RISK for Six Sigma
A key application of @RISK is Six Sigma and quality analysis. Industries ranging from engine manufacturing to precious metals to airlines and consumer goods are using @RISK every day to improve their processes, enhance the quality of their products and services, and save money.
Whether it’s in DMAIC, Design for Six Sigma (DFSS), Lean projects, Design of Experiments (DOE), or other areas, uncertainty and variability lie at the core of any Six Sigma analysis. @RISK uses Monte Carlo simulation to identify, measure, and root out the causes of variability in your production and service processes and designs.
Six Sigma Capability Metrics in @RISK
@RISK allows you to define Upper and Lower Specification Limits and Target values for each output, and comes complete with a wide range of Six Sigma statistics and capability metrics on those outputs, like Cpk, Cp, Cpm, and much more. These metrics can be placed directly in your spreadsheet model, or appear in the @RISK Results Summary window. Output graphs show markers for LSL, USL, and Target values. The Industrial edition of @RISK adds RISKOptimizer to your Six Sigma analyses for optimization of project selection, resource allocation, and more.
 The DecisionTools Suite is a complete risk analysis for Excel that includes optimization, decision tree analysis and advanced statistical tools. The DecisionTools Suite means you can judge which risks to take and which ones to avoid, allowing for the best decision making under uncertainty.